
From field survey to report-ready data.
Collect vegetation and species data in the field, tie it to your site map, and assemble monitoring and compliance reports.
For county, state, and federal agencies, and commercial landowners and developers.
Get Started →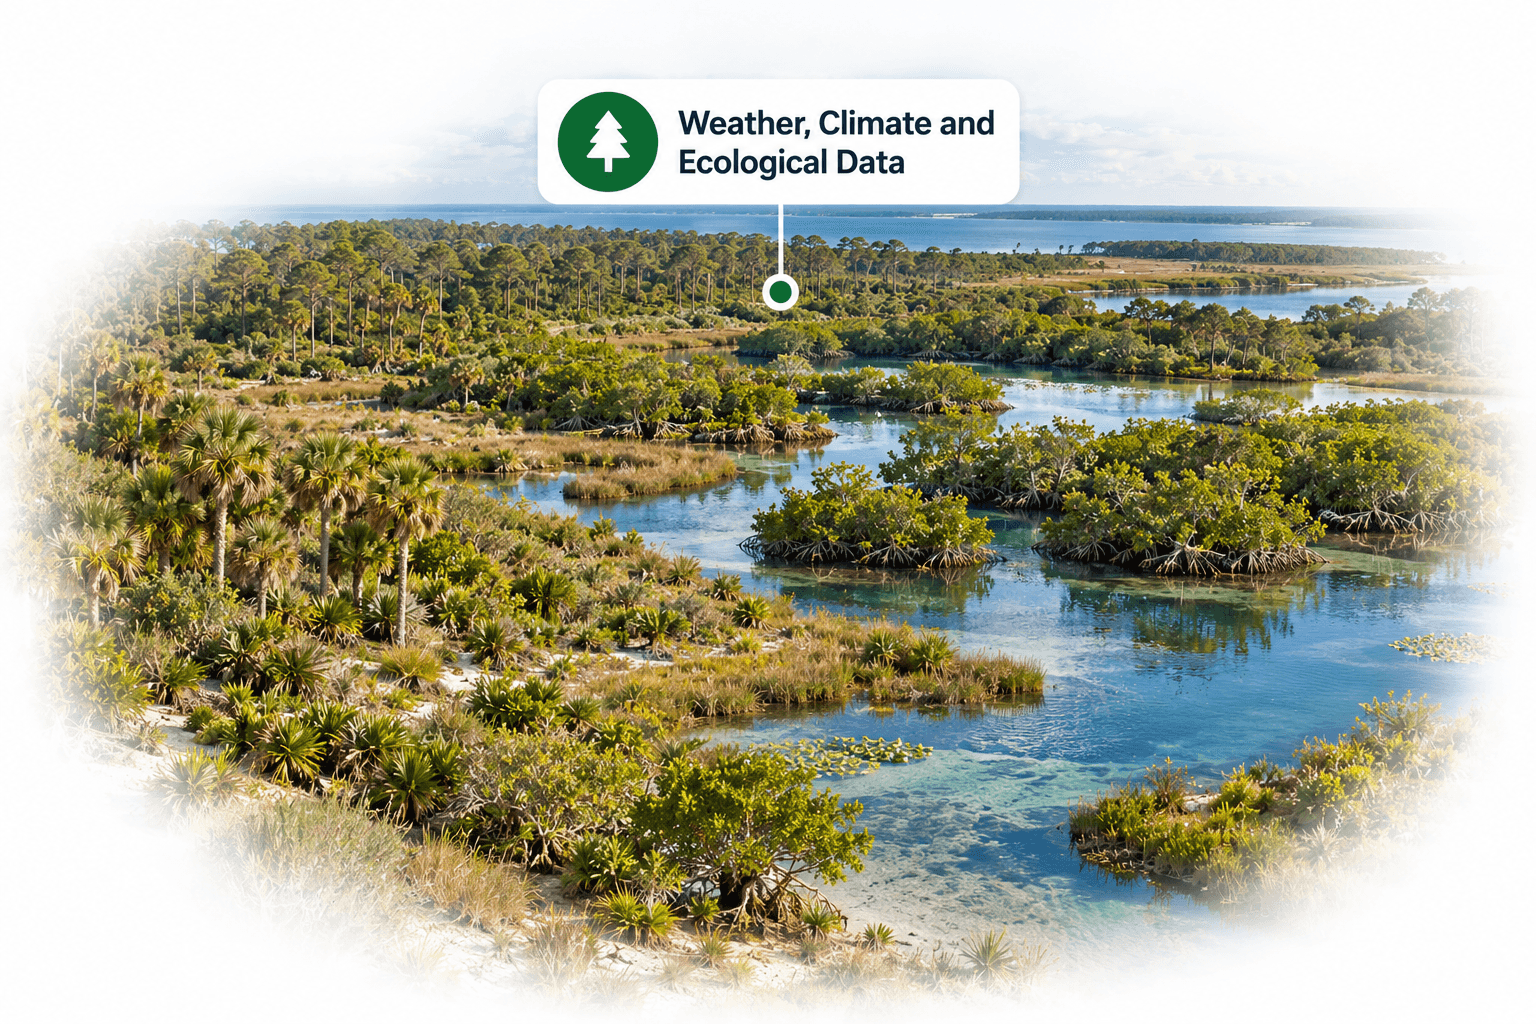
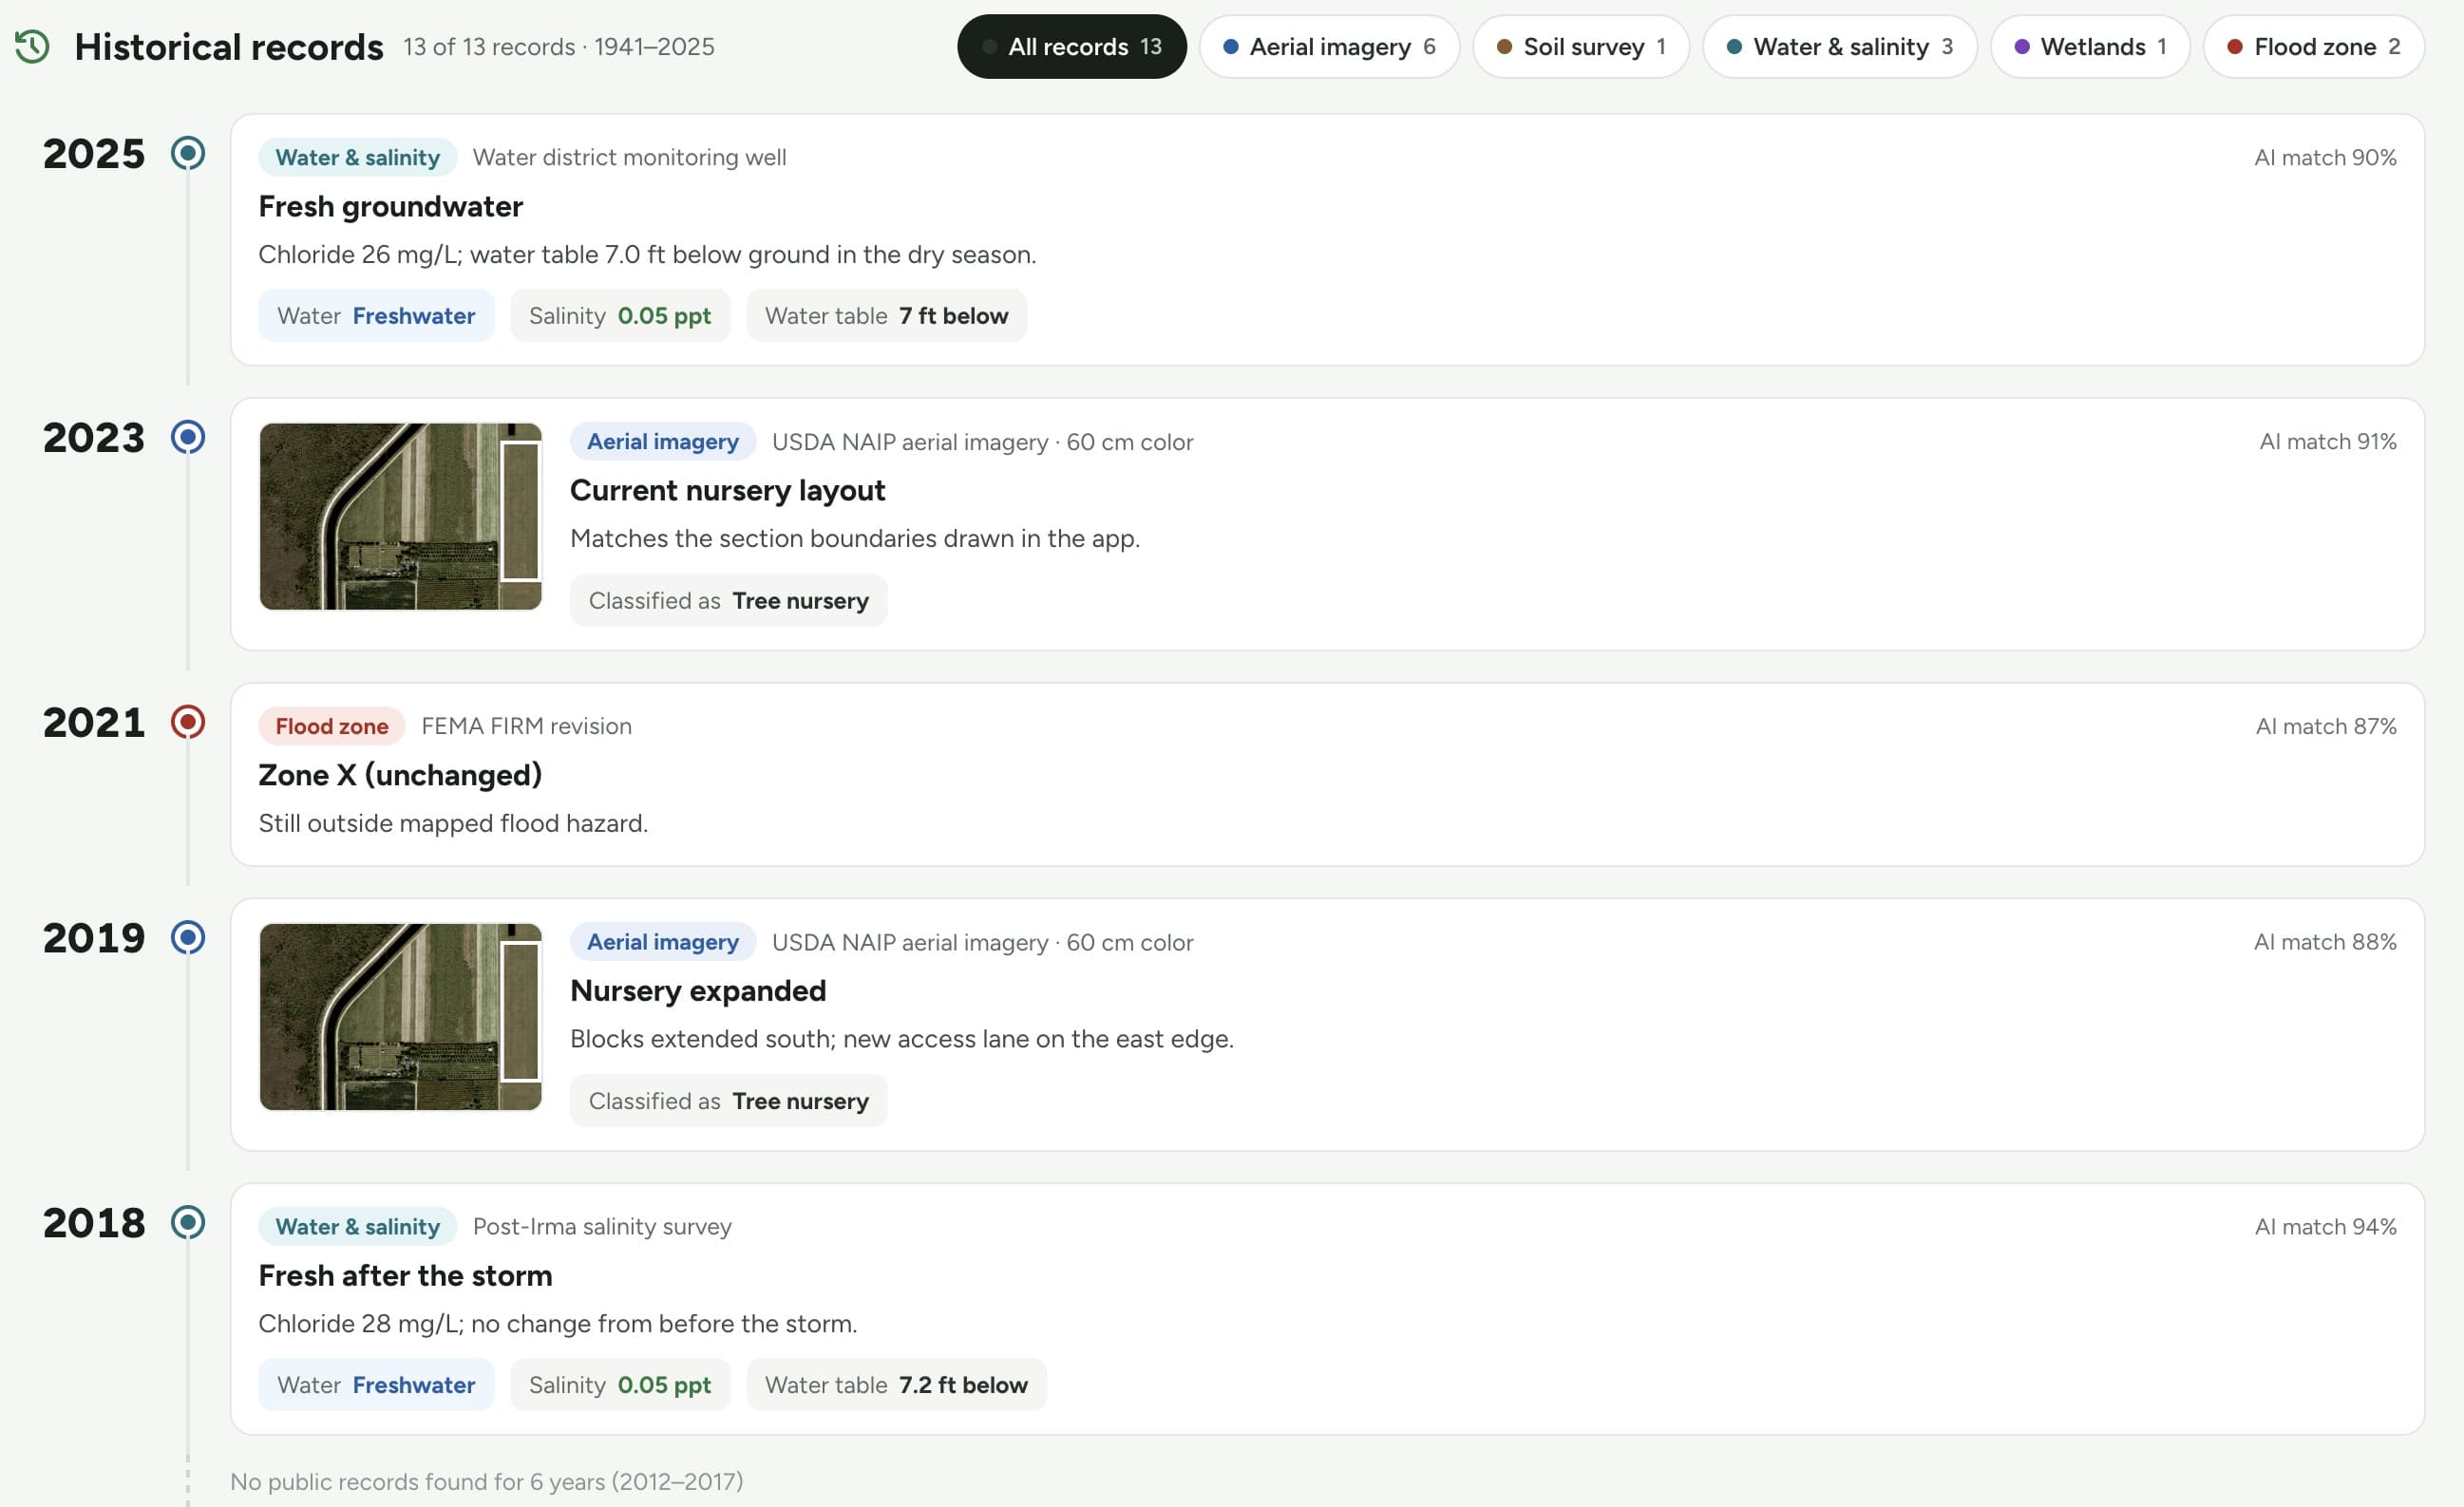
Every record for a site, on one timeline.
See how ecosystems, habitats, and climate conditions on a site have changed over time, and where they are likely to go next.



Map habitat change, site by site.
Habitat classes are mapped for each monitoring period. Compare any two years to see where habitat was gained or lost, measured in acres, then export the map with your report.
Yellow outline: example site boundary. Shapes illustrate the workflow and are not surveyed habitat data.
Select an example habitat on the map to see its class.
Illustrative site and habitat classes over Esri satellite imagery.
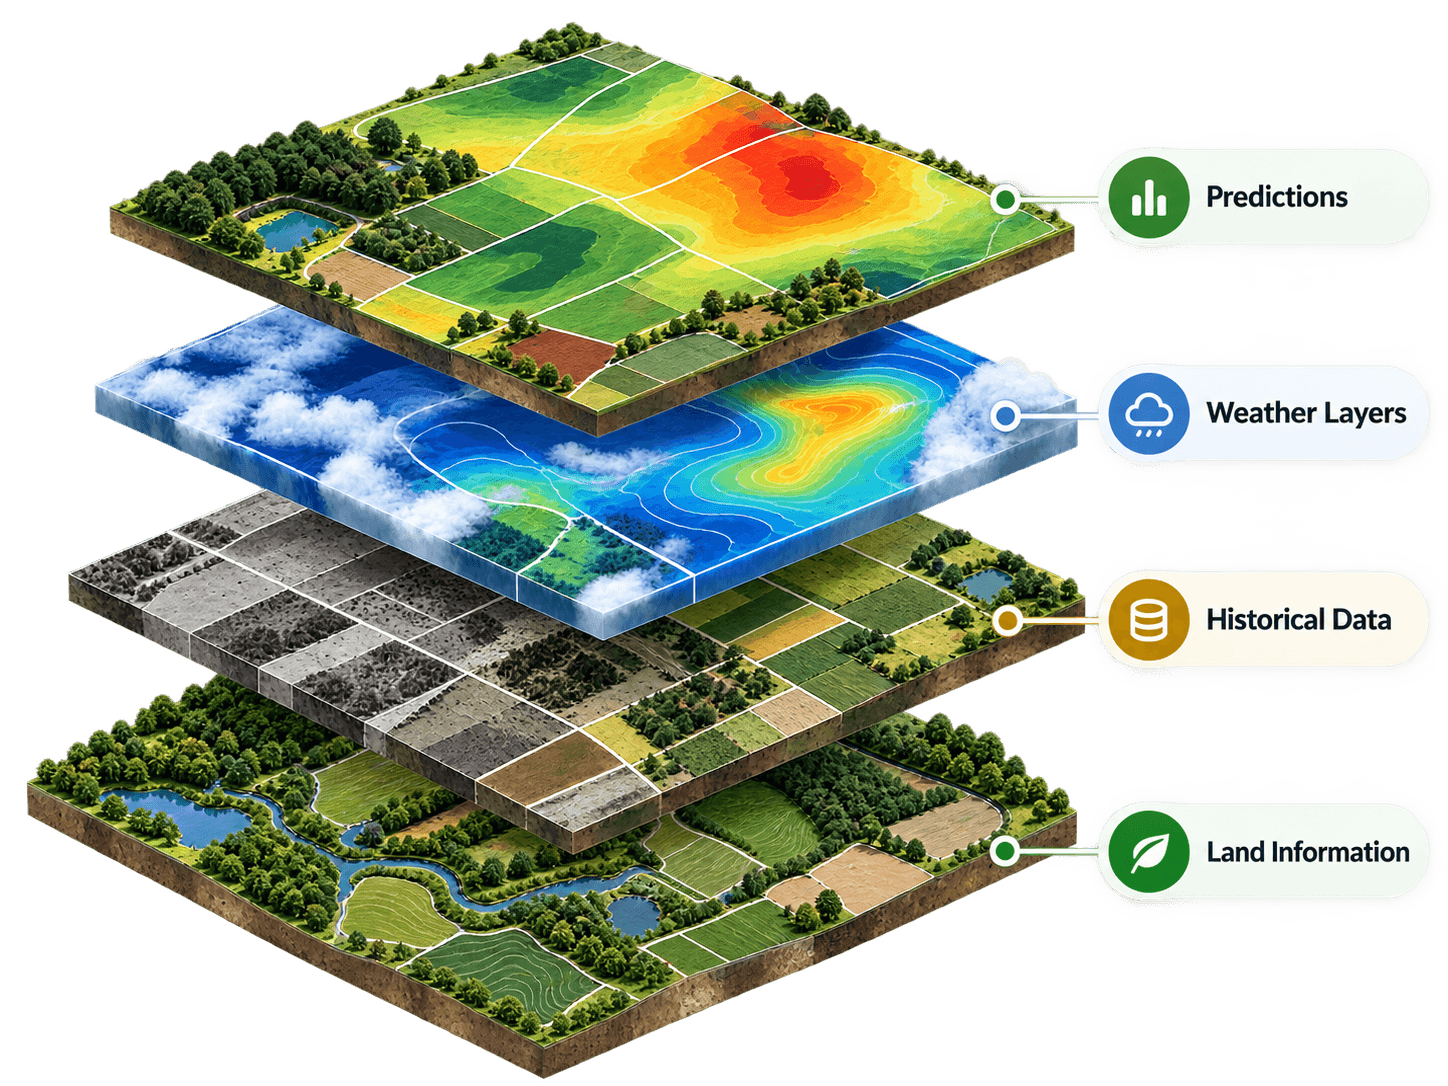
Put every survey in context.
Layer site history, weather, and ecological data over your survey results to understand how each site is performing.




Ready to see your land differently?
Join forward thinking growers and land managers who are using Eco Plant Hub™ to manage today and plan for tomorrow.
Get Started →